Example 04: Pressure-temperature phase diagram of Cu#
In this example, the pressure-temperature phase diagram of Cu will be calculated.
The EAM potential we will use is : Mishin, Y., M. J. Mehl, D. A. Papaconstantopoulos, A. F. Voter, and J. D. Kress. “Structural Stability and Lattice Defects in Copper: Ab Initio , Tight-Binding, and Embedded-Atom Calculations.” Physical Review B 63, no. 22 (May 21, 2001): 224106.
The input file is provided in the folder. The calculation is very similar to the calculation of melting temperature. However, we calculate the melting temperature for various pressures to arrive at the phase-diagram.
There are five input files in the folder, from input1.yaml to input5.yaml. Each file contains the calculations for a single pressure. You can also add all of the calculations in a single file under the calculations block. It is split here into five files for the easiness of running the calculations on relatively small machines.
The calculation can be run by:
calphy -i input1.yaml
and so on until input5.yaml. After the calculations are over, we can read in the results and compare it.
[3]:
import numpy as np
import matplotlib.pyplot as plt
The starting temperatures and pressures for our calculations:
[4]:
temp = [1600, 2700, 3700, 4600]
press = [100000, 500000, 1000000, 1500000]
Now a small loop which goes over each folder and calculates the melting temperature value:
[5]:
tms = []

for t, p in zip(temp, press):
    sfile =  "ts-FCC-%d-%d/temperature_sweep.dat"%(t, p)
    lfile =  "ts-LQD-%d-%d/temperature_sweep.dat"%(t, p)
    t, f, fe = np.loadtxt(sfile, unpack=True)
    t, l, fe = np.loadtxt(lfile, unpack=True)
    args = np.argsort(np.abs(f-l))

    tms.append(t[args[0]])
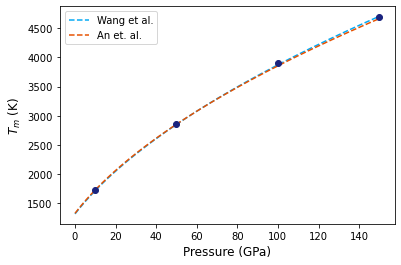
To compare our results, we will use a Simon equation, given by,
We will use reported values for parameters \(T_{m0}\), \(a\) and \(b\) from two different publications:
[6]:
def get_tm(press):
    tm = 1315*(press/15.84 + 1)**0.543
    return tm
[8]:
def get_tm2(press):
    tm = 1325*(press/15.37 + 1)**0.53
    return tm
An array for pressures over which the two equations will be fit, and values of the two expressions are calculated.
[9]:
pfit = np.arange(0, 151, 1)
tma = get_tm(pfit)
tmb = get_tm2(pfit)
[11]:
plt.plot(pfit, tma, ls="dashed", label="Wang et al.", color="#03A9F4")
plt.plot(pfit, tmb, ls="dashed", label="An et. al.", color="#E65100")
plt.plot(np.array(press)/10000, tms, 'o', color="#1A237E")
plt.xlabel("Pressure (GPa)", fontsize=12)
plt.ylabel(r"$T_m$ (K)", fontsize=12)
plt.legend()
plt.savefig("tp-diagram.png", dpi=300, bbox_inches="tight")