Example 02: Phase transformation in Fe#
In this example, we will make use of the temperature sweep algorithm in calphy to calculate the transformation temperature for BCC to FCC transition in Fe.
The EAM potential that will be used: Meyer, R, and P Entel. “Martensite-austenite transition and phonon dispersion curves of Fe1−xNix studied by molecular-dynamics simulations.” Phys. Rev. B 57, 5140.
The reference data is from: Freitas, Rodrigo, Mark Asta, and Maurice de Koning. “Nonequilibrium Free-Energy Calculation of Solids Using LAMMPS.” Computational Materials Science 112 (February 2016): 333–41.
The input file is provided in the folder. The calculation can be started from the terminal using:
calphy -i input.yaml
In the input file, the calculations block is as shown below:
- mode: ts
  temperature: [100, 1400]
  pressure: [0]
  lattice: [BCC]
  repeat: [5, 5, 5]
  reference_phase: [solid]
  n_iterations: 1
  pair_style: eam
  pair_coeff: "* * ../potentials/Fe.eam"
  n_equilibration_steps: 10000
  n_switching_steps: 25000
- mode: ts
  temperature: [100, 1400]
  pressure: [0]
  lattice: [FCC]
  repeat: [5, 5, 5]
  reference_phase: [solid]
  n_iterations: 1
  lattice_constant: [6.00]
  pair_style: eam
  pair_coeff: "* * ../potentials/Fe.eam"
  n_equilibration_steps: 10000
  n_switching_steps: 25000
The mode is listed as ts, which stands for temperature sweep. The sweep starts from the first value in the temperature option, which is 100 K. The free energy is integrated until 1400 K, which is the second value listed. Furthermore, there are also two calculation blocks. You can see that the lattice mentioned is different; one set is for BCC structure, while the other is FCC.
Once the calculation is over, there will a file called temperature_sweep.dat in each of the folders. This file indicates the variation of free energy with the temperature. We can read in the files and calculate the transition temperature as follows:
[1]:
import numpy as np
import matplotlib.pyplot as plt
[2]:
bt, bfe, bferr = np.loadtxt("ts-BCC-100-0/temperature_sweep.dat", unpack=True)
ft, ffe, fferr = np.loadtxt("ts-FCC-100-0/temperature_sweep.dat", unpack=True)
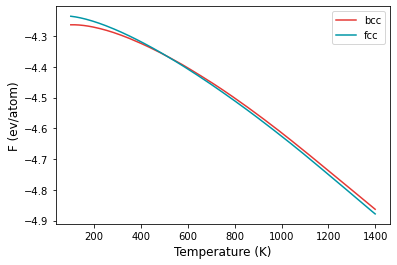
args = np.argsort(np.abs(bfe-ffe))
print(bt[args[0]], "K")
508.07011498303046 K
[3]:
plt.plot(bt, bfe, color="#E53935", label="bcc")
plt.plot(ft, ffe, color="#0097A7", label="fcc")
plt.xlabel("Temperature (K)", fontsize=12)
plt.ylabel("F (ev/atom)", fontsize=12)
plt.legend()
plt.savefig("fe_transition.png", dpi=300, bbox_inches="tight")
[ ]: