Example 08: Temperature scaling two ways#
Finding the free energy as a function of the temperature can be calculated using reversible scaling methodology (mode ts) as discussed in previous examples.
However, calphy provides another mode tscale that can be used for the same purpose. In this example, ts and tscale modes are compared. Before that:
- What is the difference between ``ts`` and ``tscale``?
tsperforms reversible scaling method. Here, the simulation is performed at a constant temperature; but the potential energy is scaled. Intscale, the temperature is directly scaled. - Why do we need ``tscale``?If
tsmode works for the given potential, it should be used.ts, however, needs the`pair hybrid/scaled<https://docs.lammps.org/pair_hybrid.html>`__. If this is not possible due to some restriction of the potential,tscalecan be used.
For this example, we will use the following EAM potential: Mishin, Y., M. J. Mehl, D. A. Papaconstantopoulos, A. F. Voter, and J. D. Kress. “Structural Stability and Lattice Defects in Copper: Ab Initio , Tight-Binding, and Embedded-Atom Calculations.” Physical Review B 63, no. 22 (May 21, 2001): 224106.
The input file is given in input.1.yaml. There are two sets of calculations, one with mode tscale, and another one with mode ts that can be used for comparison.
The calculation can be run by,
calphy -i input.1.yaml
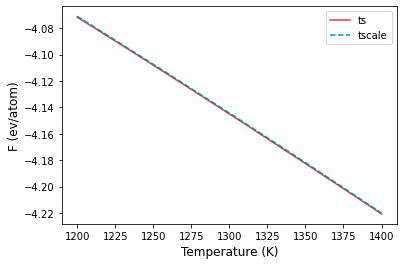
After the calculation is over, we can plot the free energy as a function of temperature.
[1]:
import numpy as np
import matplotlib.pyplot as plt
[2]:
t1, fe1, ferr1 = np.loadtxt("ts-fcc-solid-1200-0/temperature_sweep.dat", unpack=True)
t2, fe2, ferr2 = np.loadtxt("tscale-fcc-solid-1200-0/temperature_sweep.dat", unpack=True)
[4]:
plt.plot(t1, fe1, color="#E53935", label="ts")
plt.plot(t2, fe2, color="#0097A7", ls="dashed", label="tscale")
plt.xlabel("Temperature (K)", fontsize=12)
plt.ylabel("F (ev/atom)", fontsize=12)
plt.legend()

As seen from the plot above, both modes agree very well with each other.